Table of Contents
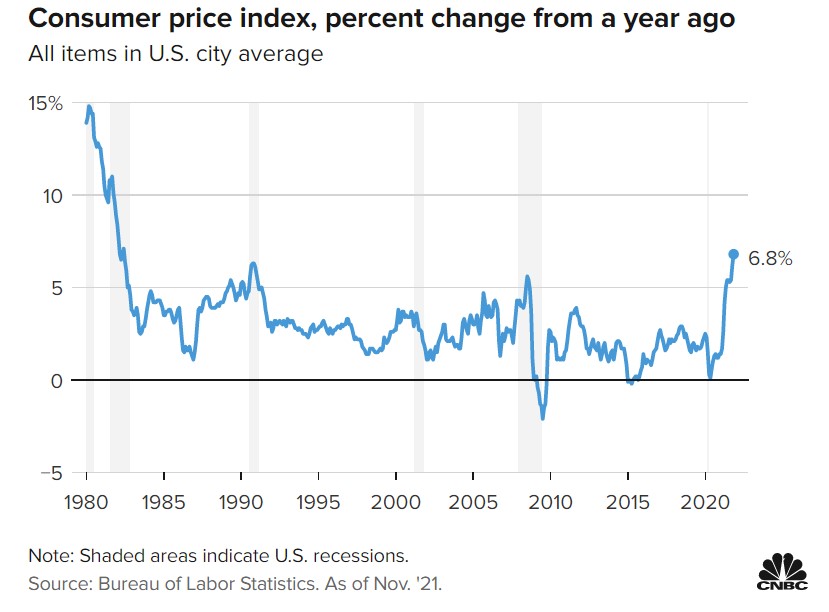
If you’ve shopped anywhere or even just watched the news no doubt you have seen that inflation has increased. A recent CNBC article reports that inflation increased 6.8% in November of 2021 compared to November of 2020.
For context, here’s a table showing the recent increase in inflation compared to the last 40+years:

Inflation is increasing
Whether this will be “transitory” or will last an extended period of time is anyone’s guess. Even Fed Chair Powell recently acknowledged that inflation has proved more persistent than he expected.
The question for investors is how this will affect our portfolios. And, should we change our portfolios in response? To figure this out, let’s take a look at what the evidence says about how inflation affects investment performance of asset classes like stocks and bonds.
Risk assets tend to beat inflation (mostly)
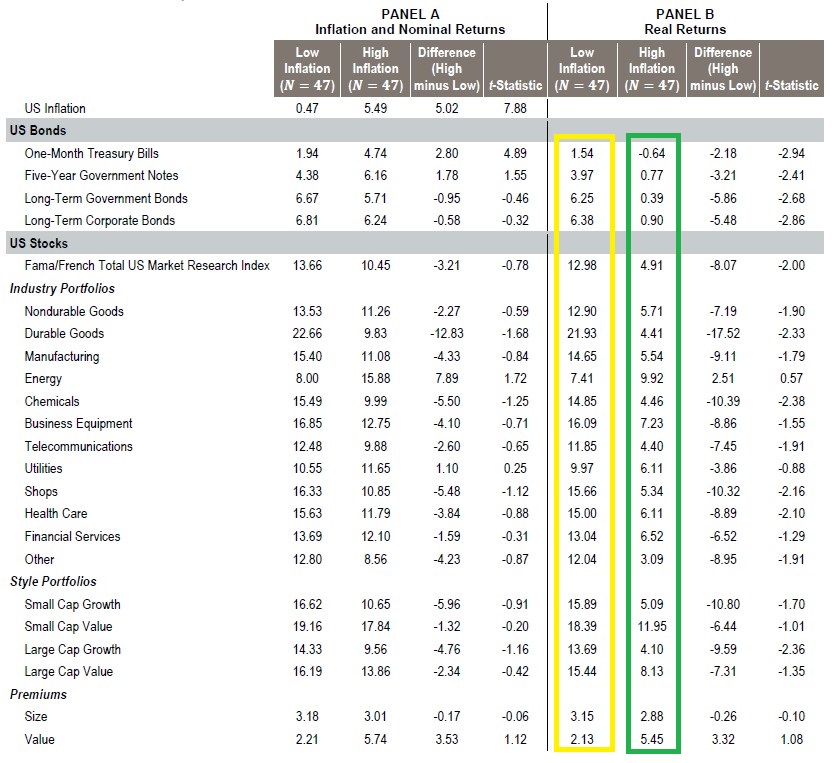
Dimensional Funds Advisors recently did a study (click here for the full study) showing how inflation affected the performance of investment asset classes like stocks and bonds. To do this they looked at two time periods: a 94 year period from 1927 to 2020 and a 30 year period for 1991 to 2020. During each time period, they calculated average annual returns for various asset classes during high inflation years and again for low inflation years.
Below is a chart with some of the results. This is for the 94 year period (1927 to 2020). In the green block you can see the average annual returns for high inflation years and the yellow are the average annual returns for low inflation years. Note these are real returns, meaning returns adjusted for inflation.

And what were the results? Here’s the good news: average annual returns of most asset classes were positive in high and low inflationary periods. Returns were lower in high inflation years, but generally still positive.
For example, the broader US stock market’s average annual returns were 4.91% during higher inflationary years vs. 12.98% during low inflationary years. Lower, but still positive.
The stronger performers during high inflation years were Small Cap Value stocks (11.95%), Energy stocks (9.92%), Large Cap Value stocks (8.13%), Business Equipment stocks (7.23%), and Financial Services Stocks (6.52%).
Just looking at the table you can see that during high inflation years Value stocks outperformed Growth stocks, and stocks in general outperformed all bond asset classes.
The one exception were One-Month Treasury Bills, which didn’t keep up with inflation.
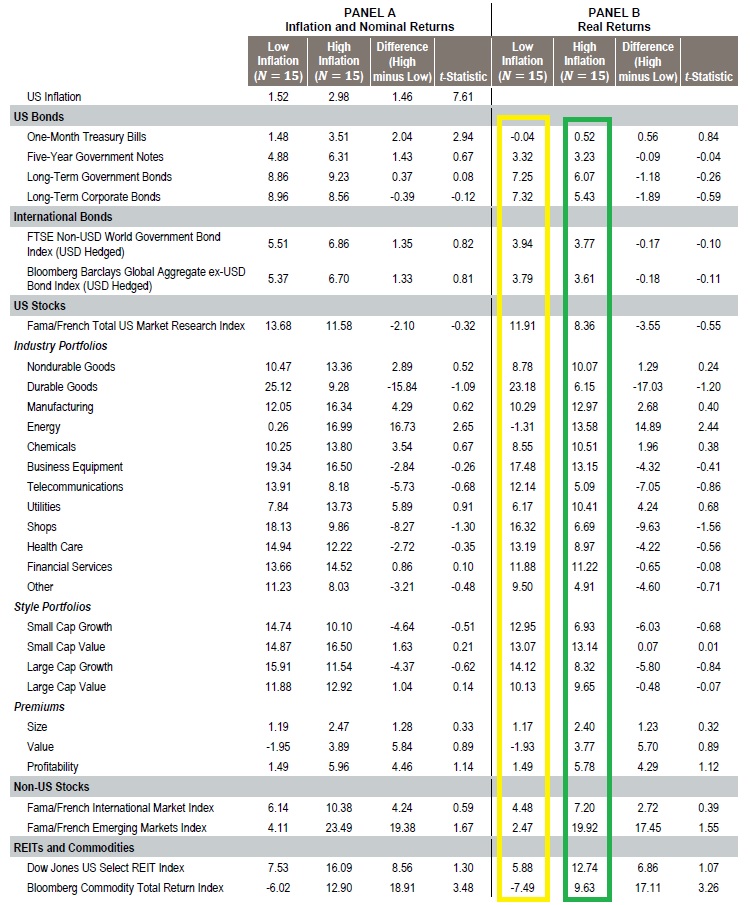
Here’s how returns fared in high inflation years for the past 30 years (1991 to 2020). They also measure some things in this period that they didn’t in the longer period: REIT’s, commodities, and international stocks.

The results are similar to the longer period: all asset classes had positive returns in the high and low inflation years. Most were lower in high inflation years, but still positive.
Again, in high inflation years we see Value stocks outperform Growth stocks, and Stocks generally outperform Bonds. Some asset classes did better in high inflation years than in low inflation years: energy stocks (13.58% vs. -1.31%), chemical stocks (10.51% vs. 8.55%), and emerging markets stocks (19.92% vs. 2.47%). Some of that is common sense: inflation is often caused by high commodity prices so of course energy companies would do better.
Again, that’s good news. Average annual returns of most/all asset classes were positive (though lower) during high inflationary years compared to lower inflation years.
Take aways
So, what should we conclude from this? One conclusion appears to be that to survive inflationary periods, just stay invested and you should be fine in the long run.
Note, though, that the same Dimensional study also shows a low correlation between most asset class returns and inflation. Meaning the vast majority of most asset class returns are explained by factors other than inflation! That means you can’t always see a high inflation environment and select one of the above asset classes thinking it will outperform during that year.
What to do? Start with the basics. Think about your investment plan and consider your risk tolerance. Based on your age and goals, you should be able to identify an asset allocation appropriate to your goals. We see above that staying invested leads you to having a good chance of beating inflation over the long term. So no need to deviate from your investment plan. It’s fine to rebalance a little over time, but you don’t need to make huge changes unless your goals change!
A few side notes:
Gold
Gold is generally not an inflation hedge, even though that may be the common wisdom. In 2021 inflation went up 6.8% but gold was down for the year by almost 4%. Studies have also shown that gold only functions as an effective inflation hedge when measured over a period of a century or more. Any shorter and it’s price volatility makes it an ineffective hedge.
TIPS
TIPS are government bonds the principal of which is adjusted up or down by the rate of change of inflation. If you buy a $1,000 TIP bond and inflation goes up 6%, your new principal amount is $1,060. You get interest on this new amount.
Mutual funds or ETFs that invest in TIPS are more complex. They respond both to inflation AND to changes in interest rates.
TIPS have out-performed vs. inflation over the past twenty years. But that’s true for most fixed income products as interest rates trended down over that period. The data shows that TIPS are better hedges for inflation when held for a long period of time, like 5+ years. TIPS have a correlation of zero so they may not hedge against inflation over shorter periods.
Alternative Minimum Tax
The Alternative Minimum Tax is triggered when you exercise an ISO in one year and and hold the stock into the next year. When that happens you have to add back the “bargain element” of the ISO to your regular taxable income. The “bargain element” is the fair market value of the stock on the day you exercised the option LESS the exercise price you paid. If the total taxable income after the add back is greater than your regular taxable income, you have to pay tax on the greater amount. That is called your Alternative Minimum Tax.
Let’s see how it works.
In our example above, the bargain amount in 2021 was $3,000 ($40 per share fair market value on exercise date less $10 per share exercise price for 100 shares). You exercised the option in 2021 and held the stock into 2022. That means for 2021, you have to add the $3,000 to 2021 your regular taxable income. You pay the greater amount of that or your regular income tax. (This would also be true if you held onto the stock through 2022 and didn’t sell.)
Disqualifying Disposition
In the above example, if you exercised and sold the stock in 2021 (and didn’t hold the stock past the end of 2021) you wouldn’t have to pay the Alternative Minimum Tax. However, the ISO would be taxed as a NQSO (See above). That means you would have to pay ordinary income taxes based on the value of the stock on the exercise date PLUS short term capital gains on the sale.
While that sounds bad, there may be circumstances when that saves you money over the normal ISO treatment.
For example, let’s say you exercise an option in 2021 and would owe $20,000 in AMT if you held onto the stock. If the stock falls in value the next year you might not be able to sell it and cover your tax bill. If you decide to sell it in 2021, it may be worth it to avoid a falling market!
In a falling market careful planning is key if you want to know whether to hold onto the stock or sell early.
Conclusion
While nothing is guaranteed, the data does seem to indicate that if you stay invested and stick to your investment plan you should be able to withstand high inflationary periods. No particular asset class will magically protect your portfolio. But equities, while riskier than bonds, do seem to withstand inflation better than other asset classes.
